Naples Florida Real Estate Market News –
July 2019
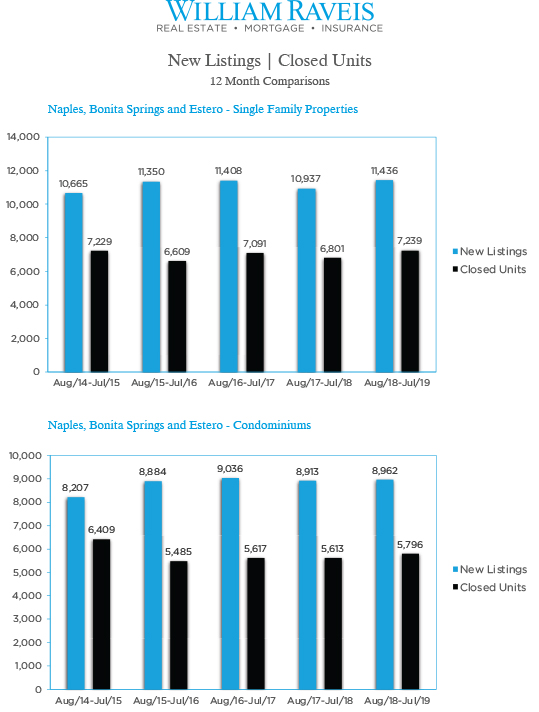
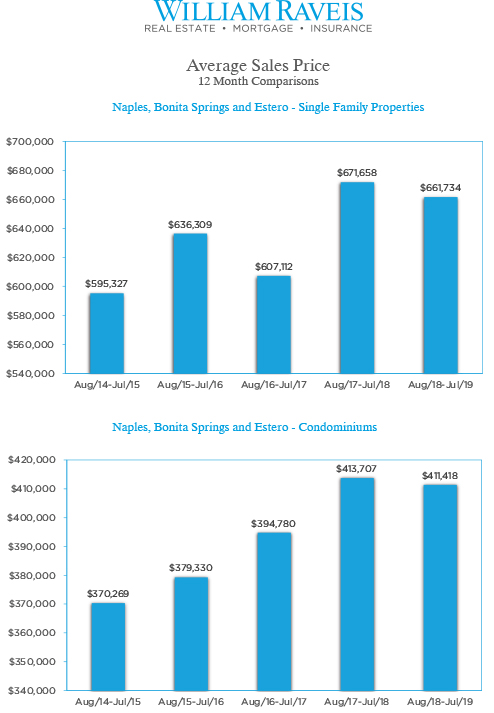
NAPLES, BONITA SPRINGS AND ESTERO – SINGLE FAMILY PROPERTIES
CLOSED SALES
- The number of closed sales in the 12 months ending July 31 , 2019 for the Naples, Bonita Springs and Estero area increased 6% year-over-year (7,239 vs 6,801).
- There were 34 closed sales, priced above two million, in July 2019 compared to 28 in July 2018 a 21% increase. During the 12 months ending July 31 , 2019, sales in this category decreased 4% over the same time period in 2018 (383 vs 401).
NEW LISTINGS / INVENTORY
- During the 12 months ending July 31 , 2019, a total of 11,436 new listings were added to the market, this is 5% more listings than the same time period, 12 months ending July 31 , 2018.
- Available inventory as of July 31 , 2019 consisted of 4,731 units, a decrease of 3% vs the same time period in 2018. Current inventory represents 8 months of supply based on current absorption rates.
AVERAGE & MEDIAN SALES PRICE
- The year-over-year average sales price for the area was $661,734 which decreased 1% over the same time period in 2018.
- The median sales price for the area decreased 2% to $385,725 vs $394,729 in 2018.
NAPLES, BONITA SPRINGS AND ESTERO – CONDOMINIUMS
CLOSED SALES
- The number of closed sales in the 12 months ending July 31 , 2019 for the Naples, Bonita Springs and Estero area increased 3% year-over-year (5,796 vs 5,613).
- There were 6 closed sales, priced above two million, in July 2019. It remained the same 6 in July 2018. During the 12 months ending July 31 , 2019, sales in this category increased 13% over the same time period in 2018 (157 vs 139 units).
NEW LISTINGS / INVENTORY
- During the 12 months ending July 31 , 2019, a total of 8,962 new listings were added to the market, approximately 1% more listings than the same time period 12 months ending July 31 , 2018.
- Available inventory as of July 31 , 2019 consisted of 3,596 units, a decrease of 6% vs the same time period in 2018. Current inventory represents 7 months of supply based on current absorption rate.
AVERAGE & MEDIAN SALES PRICE
- The year-over-year average sales price for the area was $411,418, a decrease of 1% vs the same time period in 2018.
- The median sales price for the area increased 1% to $245,364 vs $244,203 in 2018.
“The source of this real property information is the copyrighted and proprietary database compilation of Southwest Florida MLS. Copyright 2019 Southwest Florida MLS. All rights reserved. The accuracy of this information is not warranted or guaranteed. This information should be independently verified if any person intends to engage in a transaction in reliance upon it. Naples Florida Monthly Real Estate Market Update is provided by Dustin Beard.”