Naples Florida Real Estate Market News –
September 2016
12 Month Comparisons as of September 30, 2016
CLOSED SALES
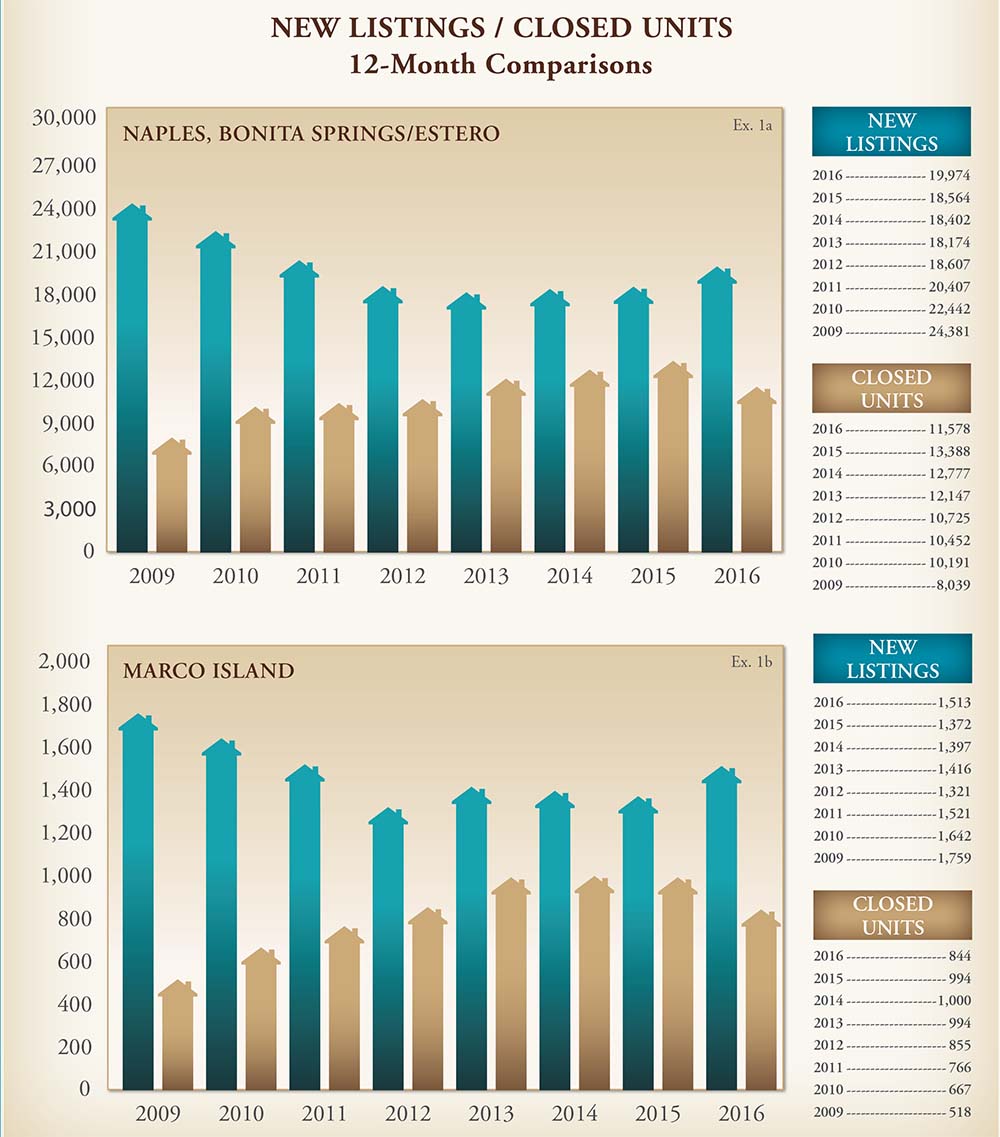
- During the 12 months ending September 30, 2016, the Naples/Bonita Springs and Estero market had a total of 11,578 closings, 14% lower than the prior 12-month period when there were 13,388. The largest sales declines were in the price segments below $250,000 (-25%) and above $5 million (-31%). (Ex 1a)
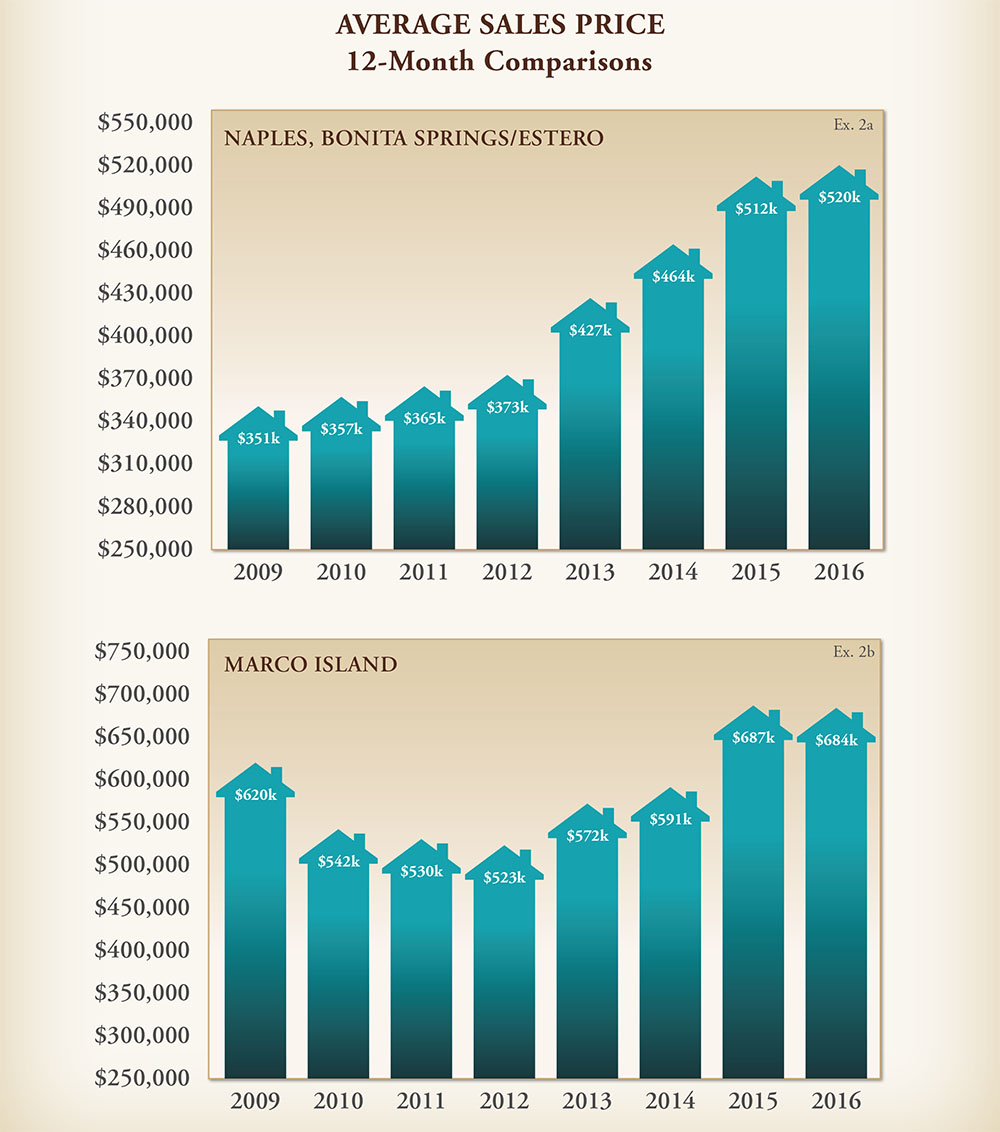
- Year-to-date closed sales for Naples/Bonita Springs and Estero were 8,928 at an average price of $522,404 vs. 10,443 at an average price of $527,022 YTD 2015. This represents a 15% sales pace reduction from last year, with pricing stable.
- Closed sales priced above $2 million year-to-date fell 24% for the Naples/Bonita Springs and Estero market, when compared to the same period in 2015. Over the past 12 months, sales in this price category are down 17% (387 vs 469).
NEW LISTINGS/INVENTORY
- Available inventory on October 1, 2016 for the Naples/Bonita Springs and Estero markets consisted of 6,081 units, up from 5,839 units last month and an increase of 43% over October 1, 2015.
- During the 12 months ending September 30, 2016, there were 19,974 new listings added to the Naples/Bonita Springs and Estero market which is 7.6% more than the same period in 2015. (Ex 1a)
AVERAGE AND MEDIAN SALES PRICE
- Average price of closed sales in the Naples/Bonita Springs and Estero market during the month of September was slightly lower year-over-year, while median closed price is up 5%.
- Average price of sales above $2 million fell 3.6% over the past 12 months, from $3,876,415 to $3,736,205. The decrease in the number of sales above $5 million likely impacted this average.
MARCO ISLAND
CLOSED SALES
- During the 12 months ending September 30, 2016, the Marco Island area had 844 closings, down 15% from the same period last year where there were 994 closings. (Ex 1b)
- Year-to-date Marco Island recorded a total of 667 closed sales at an average price of $694,049 vs. 805 sales YTD 2015 at an average price of $707,234.
NEW LISTINGS/INVENTORY
- Available inventory on October 1, 2016 for the Marco Island market consisted of a total of 640 units compared to 622 units last month.
- During the 12 months ending September 30, 2016, there were 1,513 new listings added to the Marco Island market. This represents a 10% increase over the same period last year when there were 1,372 new listings added. (Ex 1b)
AVERAGE AND MEDIAN SALES PRICE
- Average price of closed sales in the Marco Island market during the month of September showed no change year-over year, while the median pricing was up 4% from the same period last year.
“The source of this real property information is the copyrighted and proprietary database compilation of Southwest Florida MLS. Copyright 2016 Southwest Florida MLS. All rights reserved. The accuracy of this information is not warranted or guaranteed. This information should be independently verified if any person intends to engage in a transaction in reliance upon it. Naples Florida Monthly Real Estate Market Update is provided by Dustin Beard.”